When I started trading forex, I didn’t even know what a moving average was. I’d stare at charts, seeing colors and candles fly up and down, wondering how anyone could make sense of it all. I needed a way to read the market without guessing — that’s when I discovered forex indicators.
At first, it felt like diving into a new language. RSI, MACD, Bollinger Bands — all these strange acronyms. But once I learned how each tool worked and why traders relied on them, something clicked. These weren’t just lines on a screen. They were clues.
If you’re new to forex or just feeling lost in all the noise, I’ve been there. The good news? Indicators can simplify your decision-making. You just need to know where to start — and how to avoid depending on them too much.
- What forex indicators really are and how they help traders
- The most important types: trend, momentum, volatility, and volume indicators
- How to use them together without overcomplicating your charts
- Real chart examples that show indicators in action
- The biggest mistakes beginners make with indicators — and how to avoid them
By the end, you’ll not only understand how these tools work — you’ll be able to start using them with confidence. Let’s unpack the most essential tools in a forex trader’s toolbox.
What Are Forex Indicators?
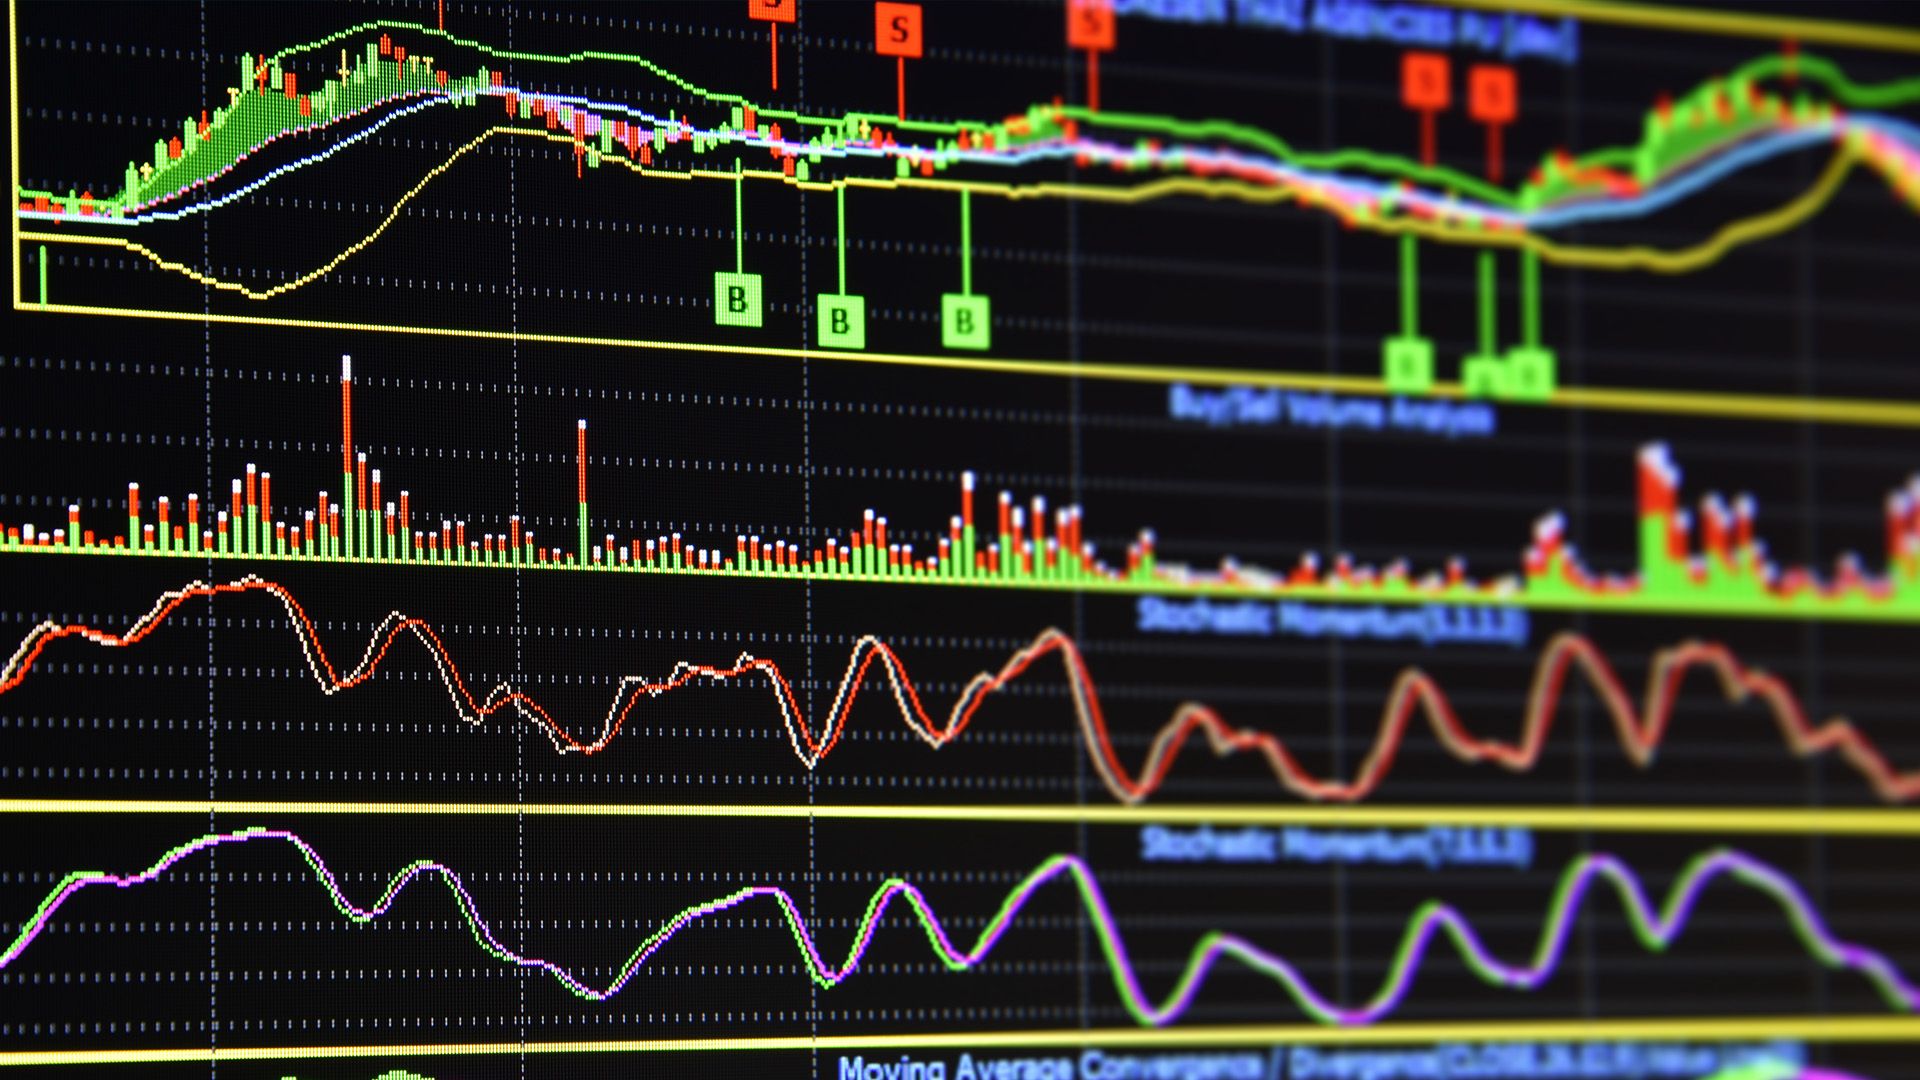
Forex indicators are tools that help you understand what the market is doing. They’re built using formulas that pull from price, volume, or time data. Some indicators tell you about the trend. Others show how fast the price is moving or if the market is too hot or too cold (overbought or oversold).
I like to think of indicators as a second opinion. The chart tells one story, but the indicators help confirm whether what I see is legit. You’re not predicting the future. You’re stacking the odds in your favor.
And here’s a quick heads-up: some indicators respond faster (leading indicators), while others confirm trends (lagging indicators). Both have their use.
Types of Forex Indicators Explained
Trend Indicators
When you want to know where the market is going, trend indicators are your best friend. I personally lean on moving averages because they smooth out all the noise and show the general direction.
Moving Averages (like SMA and EMA) give you a running average of prices over time. They help you stay in a trade longer by filtering out the tiny pullbacks that don’t mean much. EMAs react faster to price changes, which I like when I’m trading shorter time frames.
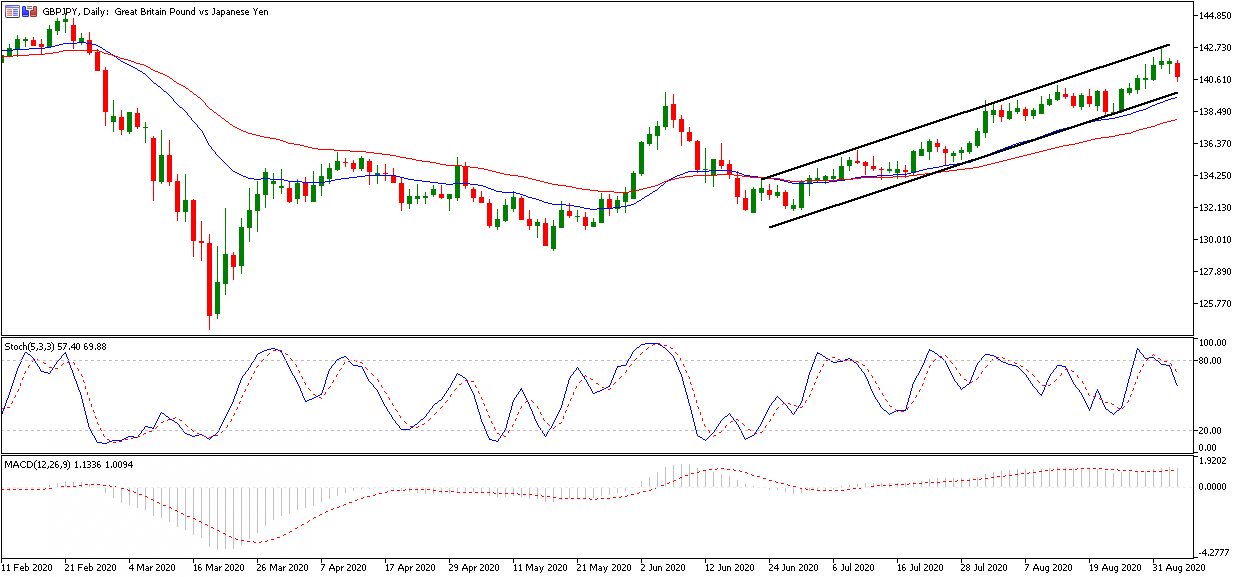
MACD (Moving Average Convergence Divergence) shows the relationship between two moving averages. What I love about MACD is the crossover signals. When the MACD line crosses above the signal line — boom, that’s a possible buy setup.
But be careful — MACD can lag, especially in fast-moving markets. That’s why I always confirm it with something else.
Momentum Indicators
Momentum indicators help you answer this question: Is the price move running out of steam or picking up speed?
RSI (Relative Strength Index) is one of the first tools I learned. It moves between 0 and 100. Above 70? Maybe overbought. Below 30? Maybe oversold. But I don’t take those signals blindly. I wait for confirmation. I’ve seen too many traders sell just because RSI hit 70, and then boom — the trend keeps going.
Stochastic Oscillator is similar. It’s better in range-bound markets. I use it when the market isn’t trending but just bouncing between support and resistance. It often shows when price is ready to flip.
Volatility Indicators
If you ever get blindsided by a breakout, it might be time to pay attention to volatility indicators.
Bollinger Bands are my go-to. They expand and contract based on how wild price is moving. When the bands squeeze, the market is sleeping. When they widen — get ready, something’s coming. I use band breakouts to time trades on news days.
ATR (Average True Range) measures how much price is moving each period. It doesn’t show direction, but it helps with setting stop losses. I usually look at the ATR value and give my stop a little breathing room beyond that.
Volume Indicators and Others
Volume tells you how much fuel is behind a move. In forex, volume is tricky since there’s no central exchange — but tick volume is still useful.
I also like Fibonacci retracement and Pivot Points to spot support and resistance levels. They’re not “magic lines,” but they often show where price might bounce or stall. Combine that with an indicator like RSI, and you’ve got a solid entry zone.
:max_bytes(150000):strip_icc()/dotdash_Final_Four_Types_of_Forex_FX_Trend_Indicators_Nov_2020-04-8a6a17fb3a8e4f4db78b5e363fda4d12.jpg)
How to Use Forex Indicators Effectively
Combining Indicators for Better Results
Here’s what took me years to learn: Don’t use too many indicators. I’ve seen traders turn their charts into rainbows, and it just ends in confusion. I like to pair one trend indicator with one momentum tool. For example, EMA + RSI. That’s it.
If they agree, I get in. If not, I wait. Adding more indicators doesn’t make you smarter — just slower.
Real Examples of Indicator Use
Let me show you how I used indicators in real trades:
Example 1: RSI on EUR/USD
Price dipped below 30 on the RSI while sitting on a strong support level. I waited for it to turn back up, then confirmed the move with a bullish candlestick. That bounce led to a 60-pip rally.
Example 2: Bollinger Breakout on USD/JPY
Bands got super tight for 3 days. I set alerts on either side. When price broke above the upper band with a volume spike — I jumped in. Quick breakout trade, out in 2 hours with profit.
Example 3: MACD Crossover on GBP/CHF
MACD line crossed above the signal line right after a double bottom. I added confirmation with a rising EMA. The trade ran for days. That setup alone is burned into my memory.
Limitations and Risks of Forex Indicators
Now don’t get me wrong — indicators are helpful, but they’re not crystal balls. They all use past data. That means they lag or give false signals, especially in choppy markets.
I’ve been burned when RSI said “buy,” but price tanked anyway. That’s why I always pair indicators with price action and support/resistance zones. No indicator should work alone. Ever.
| Type | Purpose | Common Tools | Best For |
|---|---|---|---|
| Trend | Show direction | SMA, EMA, MACD | Identifying long-term moves |
| Momentum | Show strength | RSI, Stochastic | Spotting entry/exit points |
| Volatility | Show price range | Bollinger Bands, ATR | Preparing for breakouts |
| Volume/Support | Confirm moves, spot zones | Tick volume, Pivot Points | Finding confirmation |
Tips for Beginners Using Indicators
Start with Simplicity
When I first opened a trading platform, I was overwhelmed. So I narrowed it down. I picked just two tools: EMA for trend, RSI for momentum. That’s all you need at the start. Learn how they behave on different time frames. Watch how they react around news events. Build that muscle memory before stacking more tools on top.
It’s tempting to chase fancy indicators or buy something “guaranteed to work.” But no tool replaces screen time. Start small. Stay focused. Let experience be your best teacher.
Use a Demo Account
I spent my first six months trading fake money on a demo account. It was the best decision I made. No pressure. No loss. Just learning. I tested indicators, changed settings, even broke every rule — and learned from every mistake.
If you’re serious about using indicators well, don’t rush into real money. Open a free demo account on MetaTrader 4 or 5. Practice spotting setups. Log your trades and review them weekly. That’s how real skills are built.
Focus on Learning, Not Winning
Forex trading isn’t about quick wins. It’s about consistency. Indicators can help, but only if you understand what they’re telling you. Don’t trade just because RSI says so. Learn to combine it with support/resistance or candlestick patterns. The goal is to become a better decision-maker — not just chase signals.
FAQs About Forex Indicators
What’s the best forex indicator for beginners?
I recommend starting with the Exponential Moving Average (EMA) and the Relative Strength Index (RSI). EMA shows trend direction, and RSI helps with entry timing. They’re simple, effective, and widely used by pros too.
Can you trade forex using indicators only?
Technically, yes — but I don’t recommend it. Indicators help you understand the market, but they lag. I always combine them with price action and key support/resistance levels. Indicators alone don’t give the full picture.
Are forex indicators accurate?
They’re accurate at showing historical behavior. But they don’t predict the future. That’s why you’ll hear traders say, “Don’t blindly trust any signal.” The market changes fast. Use indicators to confirm — not to guess.
Real-Life Proof: How Indicators Helped Me Improve
I remember a trade on EUR/GBP. Price had been consolidating for days. I noticed Bollinger Bands tightening — classic setup. I watched RSI dip near 30. Once price bounced off the lower band and RSI turned upward, I entered. That trade gave me a clean 90 pips. It wasn’t luck. It was about combining tools, waiting patiently, and acting only when they lined up.
I also learned the hard way when I relied only on MACD in a news-driven market. It showed a bullish crossover, but I ignored the fact that NFP (Non-Farm Payroll) data was dropping in 10 minutes. Got stopped out fast. Lesson learned — never ignore the context.
Recap of Key Points
We’ve covered a LOT. From understanding what forex indicators do, to choosing the right ones for your style, to using them together and practicing safely on a demo account. You also saw real trade examples and learned how to avoid common mistakes.
Final Takeaway
Indicators aren’t magic. But when you understand how to read them — and when to trust them — they can seriously improve your confidence and results. The secret is simplicity. Less is more. Clarity beats complexity.
Closing Thought
Every trader starts confused. I sure did. But if you take time to learn your tools, journal your progress, and stick with it — things will start to make sense. And when they do, forex trading becomes not just possible, but empowering. Trust your journey. You’ve got this.
Learn more Forex Trading Basics.