If you’re just stepping into Forex, reading a chart can feel like deciphering alien code. I remember the first time I opened a MetaTrader 4 chart—I stared at red and green bars and thought, “What the heck am I looking at?”
Not knowing how to read charts is one of the fastest ways to burn your money. That’s what happened to me. I bought a pair during a sideways trend, thinking it was going up. Spoiler: it didn’t.
Eventually, I figured it out—slowly, and with a bunch of wrong trades along the way. But when it clicked? Everything changed. I started spotting real trends, skipping bad setups, and managing risk like a grown-up.
In this guide, I’ll show you how to go from confused to confident—using the exact steps I took (and wish I had from day one):
- The different types of Forex charts and what they show
- How to spot trends, patterns, and key levels
- Using indicators like RSI and moving averages
- Practical ways to practice reading charts risk-free
You’re not just learning to read squiggly lines—you’re learning to trade smarter, faster, and with purpose. Let’s get into it.
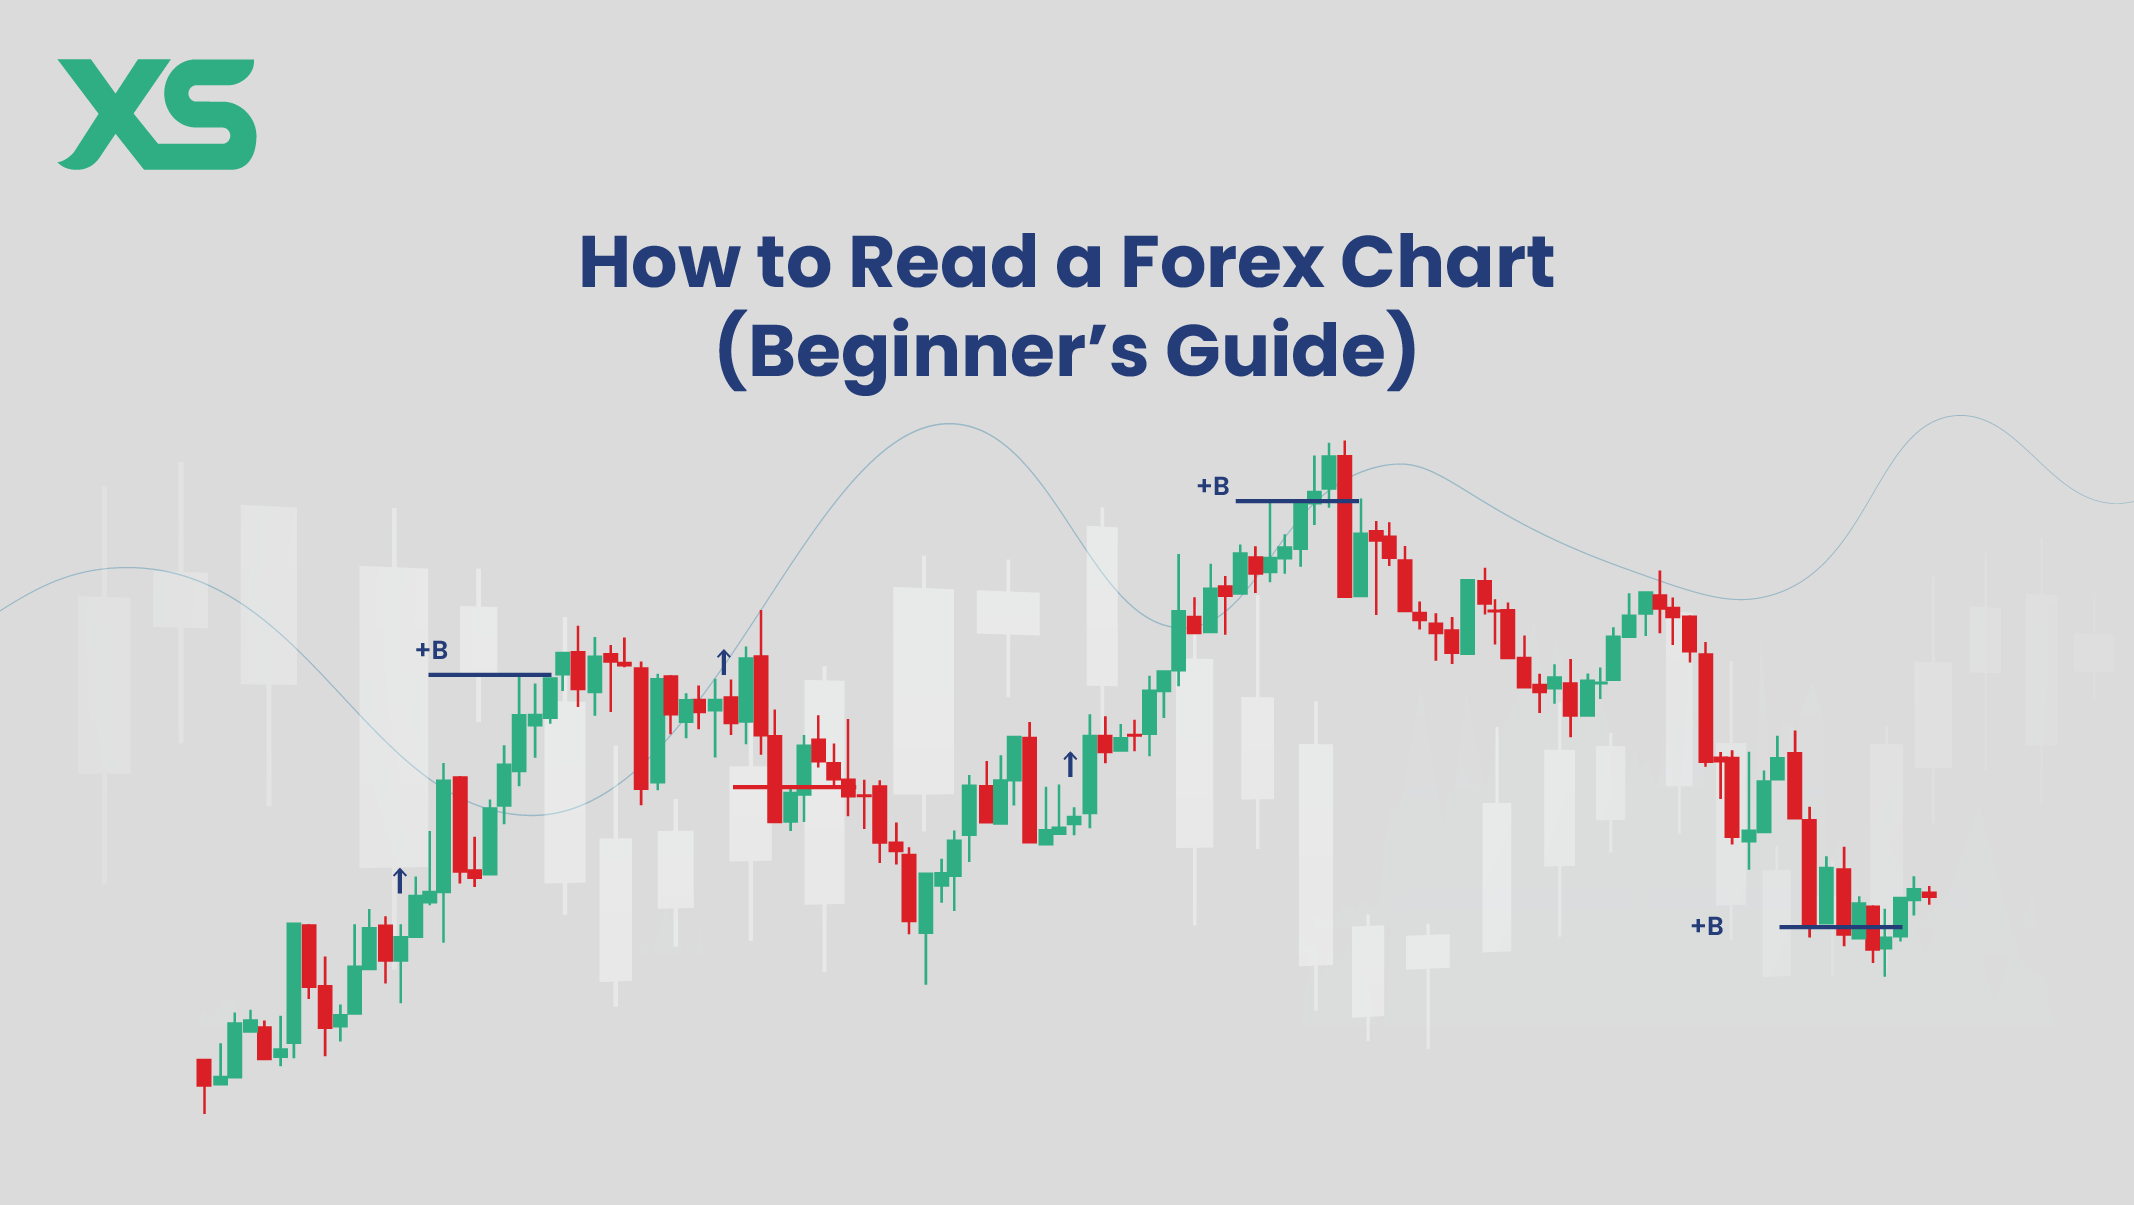
What Is a Forex Chart?
A Forex chart shows how a currency pair moves over time. Think of it like a heartbeat monitor for a market—every tick shows traders getting in, getting out, or hesitating. These movements form trends, patterns, and clues.
Most charts will show:
- Price on the vertical axis
- Time on the horizontal axis
- Volume (sometimes)
- Currency pair at the top (like EUR/USD)
I mostly trade the EUR/USD. It’s liquid, smooth, and less erratic. When I started tracking its daily chart, I finally understood why patience mattered.
Types of Forex Charts Explained
Each chart type offers a different “lens” into the market. Some are basic, others are detailed. Here’s what I’ve used and how they helped:
Line Charts
This is the simplest format. It just connects the closing prices with a line. Great if you want a big-picture look—like a monthly chart trend—but it hides a lot of details like price spikes or dips.
I used line charts when journaling long-term trends, but never for actual trade entries. Not enough info.
Bar Charts
More advanced. They show open, high, low, and close (OHLC) for each candle. That tiny tick on the left? It’s where the bar opened. Tick on the right? Where it closed. Vertical bar = high and low.
If you’re into precise data, this is useful. I used bar charts in my early MetaTrader 4 days before switching fully to candlesticks.
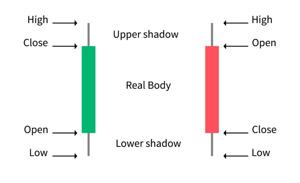
Candlestick Charts
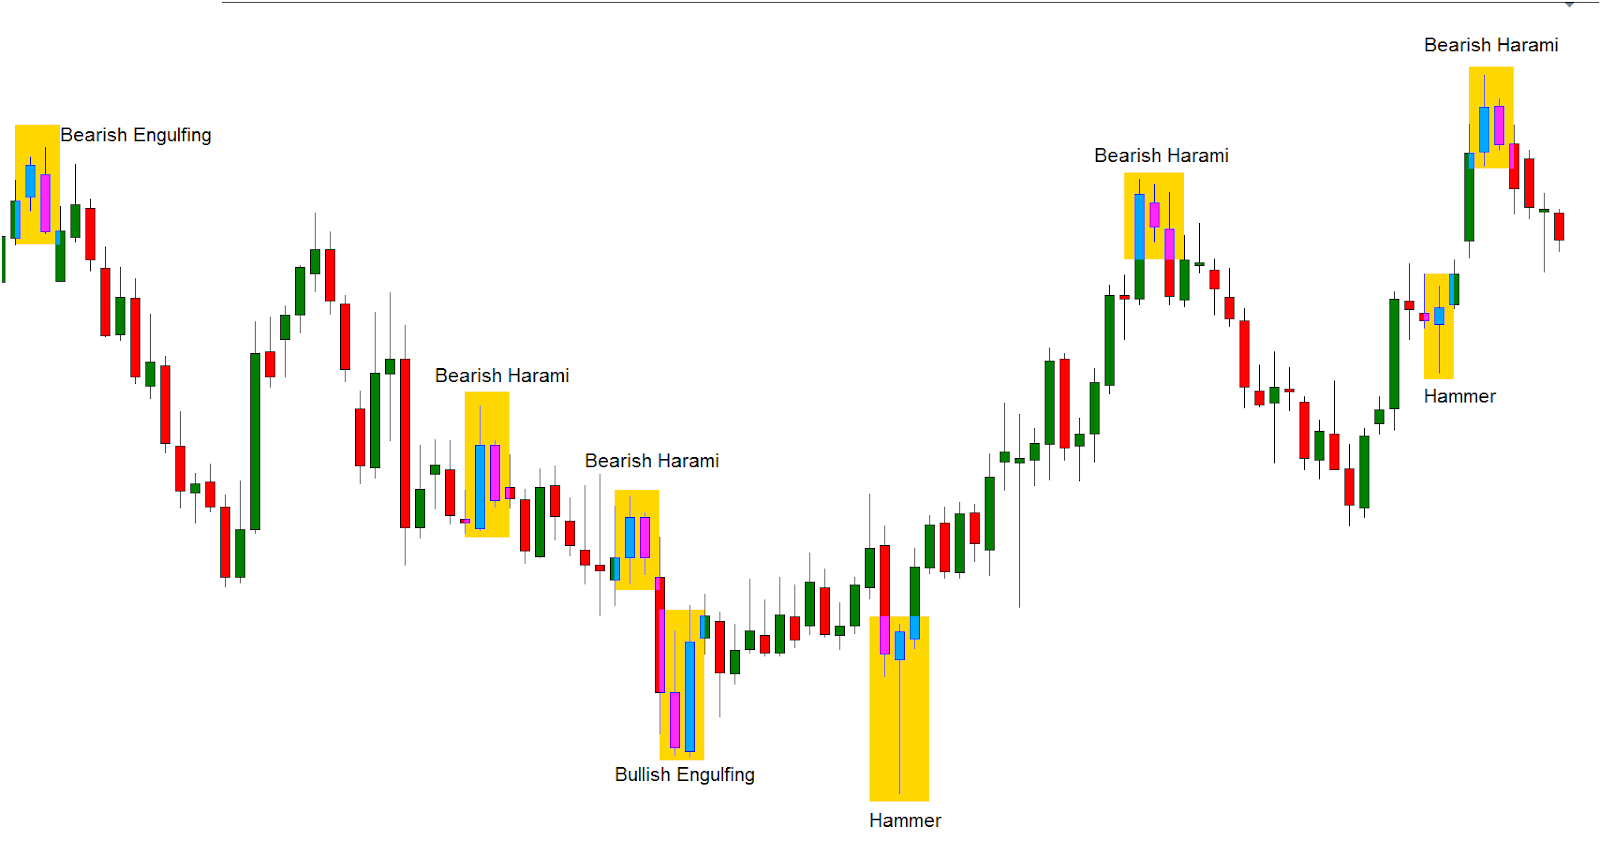
This is where things get juicy. Each “candle” shows the same data as a bar chart—open, high, low, close—but it’s color-coded and easier on the eyes. Red or black for bearish, green or white for bullish.
Once I learned a few patterns (like the hammer, engulfing, or doji), candlesticks became my go-to tool for finding momentum shifts.
Key Elements on a Forex Chart
Charts aren’t just pictures. They’re tools. Here’s what you need to recognize every time you load a chart.
Time Frame
This was one of my biggest mistakes as a newbie—I kept switching time frames trying to “find the perfect setup.” Spoiler: that’s how you confuse yourself.
Use shorter frames (1M, 5M, 15M) for day trading. Use longer ones (4H, daily, weekly) for swing trades. I personally stick to the 1-hour and daily combo: 1-hour for entries, daily for trend bias.
Price Levels and Pips
A pip is the smallest price change a currency pair can make. On most pairs, it’s the fourth decimal (0.0001). Knowing how to calculate pips helps you measure risk and reward.
Price levels—like 1.0800 or 1.1000—act as support and resistance. I mark them using horizontal lines on my charts. It’s simple but powerful.
Volume and Market Activity
Volume isn’t always available in spot Forex trading, but some platforms give it. I don’t trade solely on volume, but I’ll peek at spikes—they usually mean a breakout or fakeout is coming.
How to Analyze Forex Charts
This is where theory meets execution. You’re not just reading—you’re interpreting.
Identify Trends
Start with this: are prices making higher highs and higher lows (uptrend), or lower highs and lower lows (downtrend)? If neither, it’s a sideways market.
I use a basic trendline tool. Draw from one low to the next higher low. If it breaks, trend might be changing.
Support and Resistance
Support is where price tends to bounce up. Resistance is where it gets rejected. These levels are psychological and technical.
I mark zones, not lines. Why? Because price rarely respects a perfect line. Think of them like speed bumps—not walls.
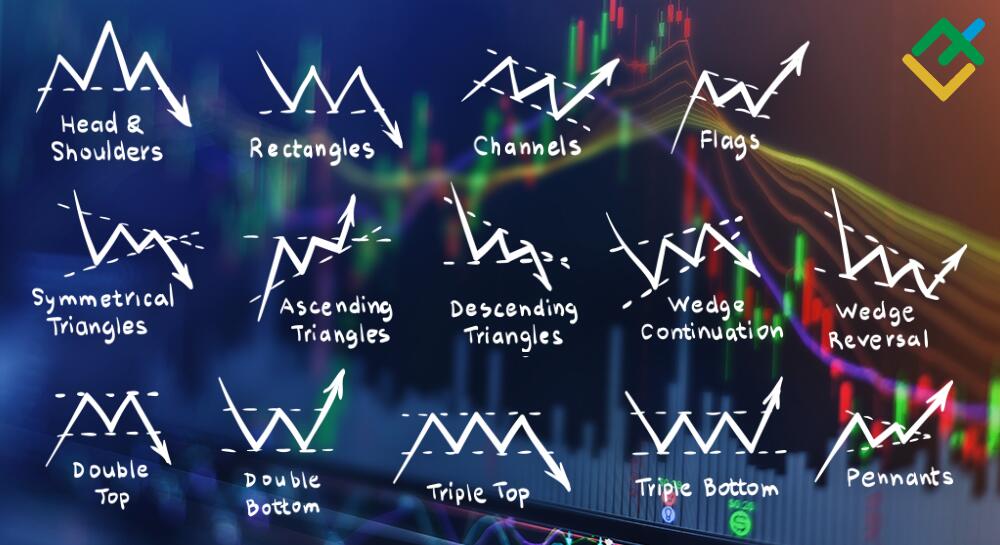
Recognize Chart Patterns
Some of my favorite patterns are:
- Head and Shoulders – reversal
- Flags and Pennants – continuation
- Double Tops/Bottoms – reversal signals
I used to ignore patterns. Then I learned that the best ones show up at key levels—with strong candles. Now, I wait for confirmation before jumping in.
Using Technical Indicators with Charts
Indicators are tools, not crutches. I only use a few—RSI, moving averages, and MACD—because less is more.
Moving Averages
I love the 50 EMA and 200 EMA. They help me spot trend direction fast. When the 50 crosses above the 200? That’s a bullish sign. Vice versa? Possible sell.
RSI and MACD
RSI (Relative Strength Index) tells me when something’s overbought (above 70) or oversold (below 30). It’s not a signal by itself, but it gives context.
MACD shows momentum and divergence. I mainly look for crossovers around the zero line—it’s helped me avoid false breakouts more than once.
Bollinger Bands and Others
Bollinger Bands show volatility. When price touches the upper band and RSI is overbought? I brace for a pullback.
I don’t stack too many indicators. One or two well-understood tools beat five confusing ones any day.
How to Practice Chart Reading
You won’t master this by reading. You have to practice—daily. That’s how I built confidence.
Using a Demo Account
I started on the eToro demo. No risk. Just pure learning. Open trades, analyze charts, track results—without losing sleep.
Backtesting Strategies
Use tools like Forex Tester. Load historical data, test your setups, and refine your edge. I backtested a simple moving average strategy on EUR/USD and saw why it failed in choppy markets—but thrived in trends.
| Tool | Purpose | Why I Use It |
|---|---|---|
| MetaTrader 4 | Charting & Trading | Simple, fast, supports EAs |
| TradingView | Advanced Chart Analysis | Clean charts, community ideas |
| Forex Tester | Backtesting | Realistic historical simulation |
What Is the Best Forex Chart Type for Beginners?
In my opinion, candlestick charts are the best starting point. They’re visual, easy to understand, and packed with information. You’ll see the open, high, low, and close—and get instant feedback on market mood with bullish or bearish colors.
When I made the switch from line to candlesticks, it was like putting on glasses for the first time. Suddenly, I could see reversals forming, consolidation zones, and price rejection. It just clicked.
That said, it depends on your style. If you’re a data-driven trader, you might prefer bar charts. If you only want trend direction and don’t care for intraday action? Line charts are your friend. But for most beginners, candlesticks give you the best of both worlds—clarity and detail.
How Do I Know If a Trend Is Strong?
I ask myself three questions:
- Is price making consistent higher highs or lower lows?
- Is volume increasing during trend moves?
- Are key moving averages aligned (like 50 EMA above 200 EMA in an uptrend)?
If the answer is yes to all three, I trust the trend. Otherwise, I stay cautious. One trick I use is checking how far price pulls back. In a strong trend, retracements are shallow and quick. If it pulls back deep and stalls? The trend might be weakening.
Can I Trade Using Only Charts?
Short answer: yes. Long answer: you need context.
Charts show you price action, but they don’t tell you the full story. I combine chart reading with fundamental awareness—like news, interest rate decisions, or economic reports. I don’t rely on fundamentals, but I respect them. A clean chart setup can fail hard during a surprise Fed announcement.
So, yes—you can trade with charts alone. But you’ll trade better when you add basic fundamentals and strong risk management.
Real-Life Experience: How Charts Changed My Trading
I used to chase random trade ideas from forums and YouTube videos. I’d enter because someone said, “EUR/USD is about to explode.” I didn’t even check the chart.
Eventually, I got burned. Over and over. One day, I printed a blank candlestick chart and tried to make sense of it. I started marking up trends, zones, patterns. That single exercise was more valuable than 10 hours of theory videos.
Now, I never enter a trade unless the chart gives me a reason. I follow the price, not opinions. My trades are cleaner, my stops are tighter, and my mindset is calmer.
Recap of Key Points
Reading Forex charts is a critical skill that unlocks everything else in trading. We’ve covered:
- The main chart types (line, bar, candlestick)
- How to interpret time frames, price levels, and volume
- Spotting trends, patterns, support, and resistance
- Using tools like RSI, moving averages, and Bollinger Bands
- Practicing through demos and backtesting
Final Takeaway
If you’re serious about trading Forex, chart reading isn’t optional—it’s essential. I’ve seen traders go from frustrated to focused just by learning how to “read the room” through a candlestick chart. You can do the same.
Closing Thought
This isn’t about memorizing patterns or using a hundred indicators. It’s about learning to trust what the market is showing you—visually. The more time you spend with charts, the more fluent you become in the language of price.
Start simple. Stay consistent. And let the charts guide you.