Back when I started trading, I was overwhelmed by charts, economic data, and flashy indicators. I had no idea how traders decided when to buy or sell. I remember staring at a USD/JPY chart and wondering—do people actually understand all this? I sure didn’t.
Turns out, there are two major ways to analyze the forex market: technical analysis and fundamental analysis. But knowing that isn’t enough. You’ve got to know when to use each—and why.
That’s where many new traders hit a wall. They bounce between strategies, lose confidence, and keep asking the same question: “Which one works better?” I’ve been there too.
What helped me was breaking them down, testing each, and eventually learning how to combine both to build a strategy that matched my style. Today, I’ll walk you through that same approach.
In this guide, you’ll learn:
- The core difference between technical and fundamental analysis
- Which tools belong to each approach
- When to use them depending on your trading style
- How to combine both for smarter entries and exits
By the end, you’ll feel more confident about analyzing the market. You’ll stop guessing and start trading with real purpose. Let’s dig in.
What Is Forex Market Analysis?
If you’re trading currencies, you’re trying to predict price direction. Forex market analysis is how traders do just that—by studying either price behavior or economic factors.
Why Market Analysis Matters in Forex
Here’s the truth: If you skip analysis, you’re just gambling. I learned that the hard way. I used to enter trades based on gut feelings and Twitter tips. Big mistake.
Whether you’re scalping the EUR/USD or holding AUD/JPY for a week, you need a system to spot trends, time entries, and manage risk. That system comes from analysis.
Technical Analysis: Reading the Charts
Technical analysis is all about price action. It assumes that everything—news, emotions, expectations—is already baked into the price. So instead of watching the news, you’re watching the charts.
Key Tools and Concepts in Technical Analysis
When I started using technicals, I fell in love with these tools:
RSI (Relative Strength Index): This one tells me when a pair is overbought or oversold. If RSI is above 70, I get cautious. Below 30, I look for reversals.
MACD (Moving Average Convergence Divergence): A fancy name, but super useful. It shows momentum shifts. Crossovers between the MACD line and signal line often signal upcoming moves.
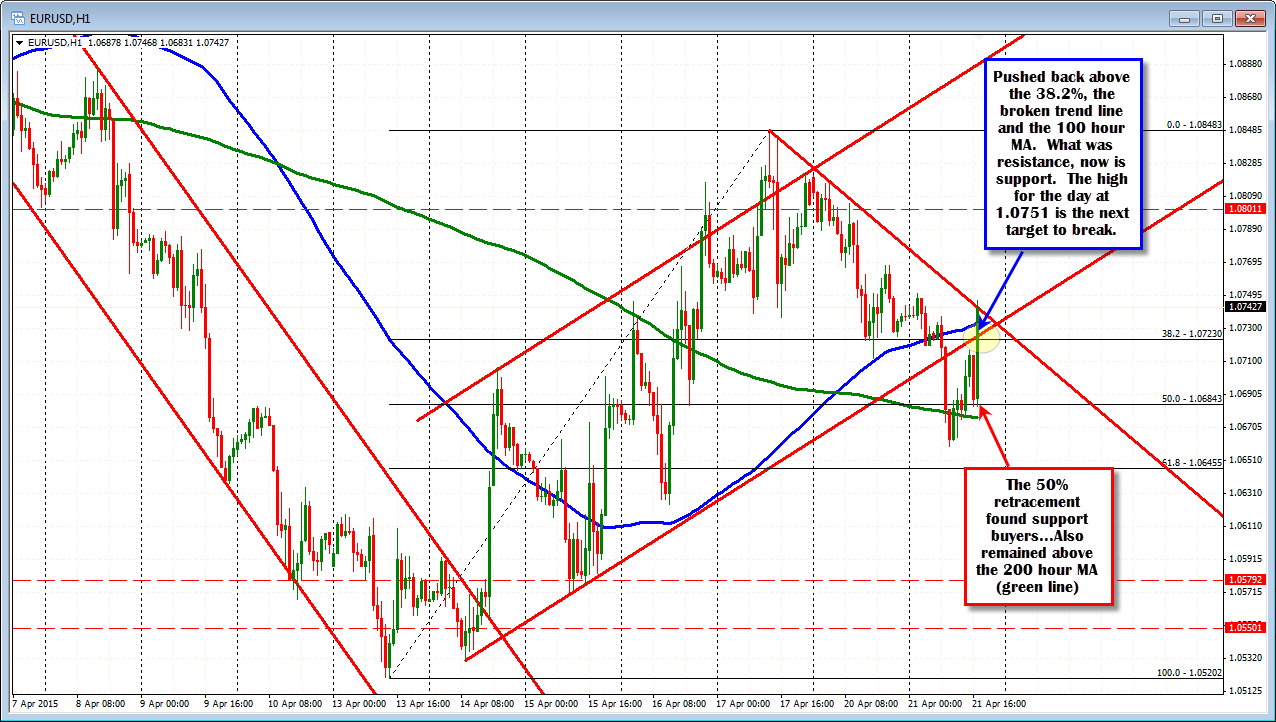
Support and Resistance: These are price levels where the market tends to pause or reverse. I map them out using horizontal lines, and they help me plan entries and exits.
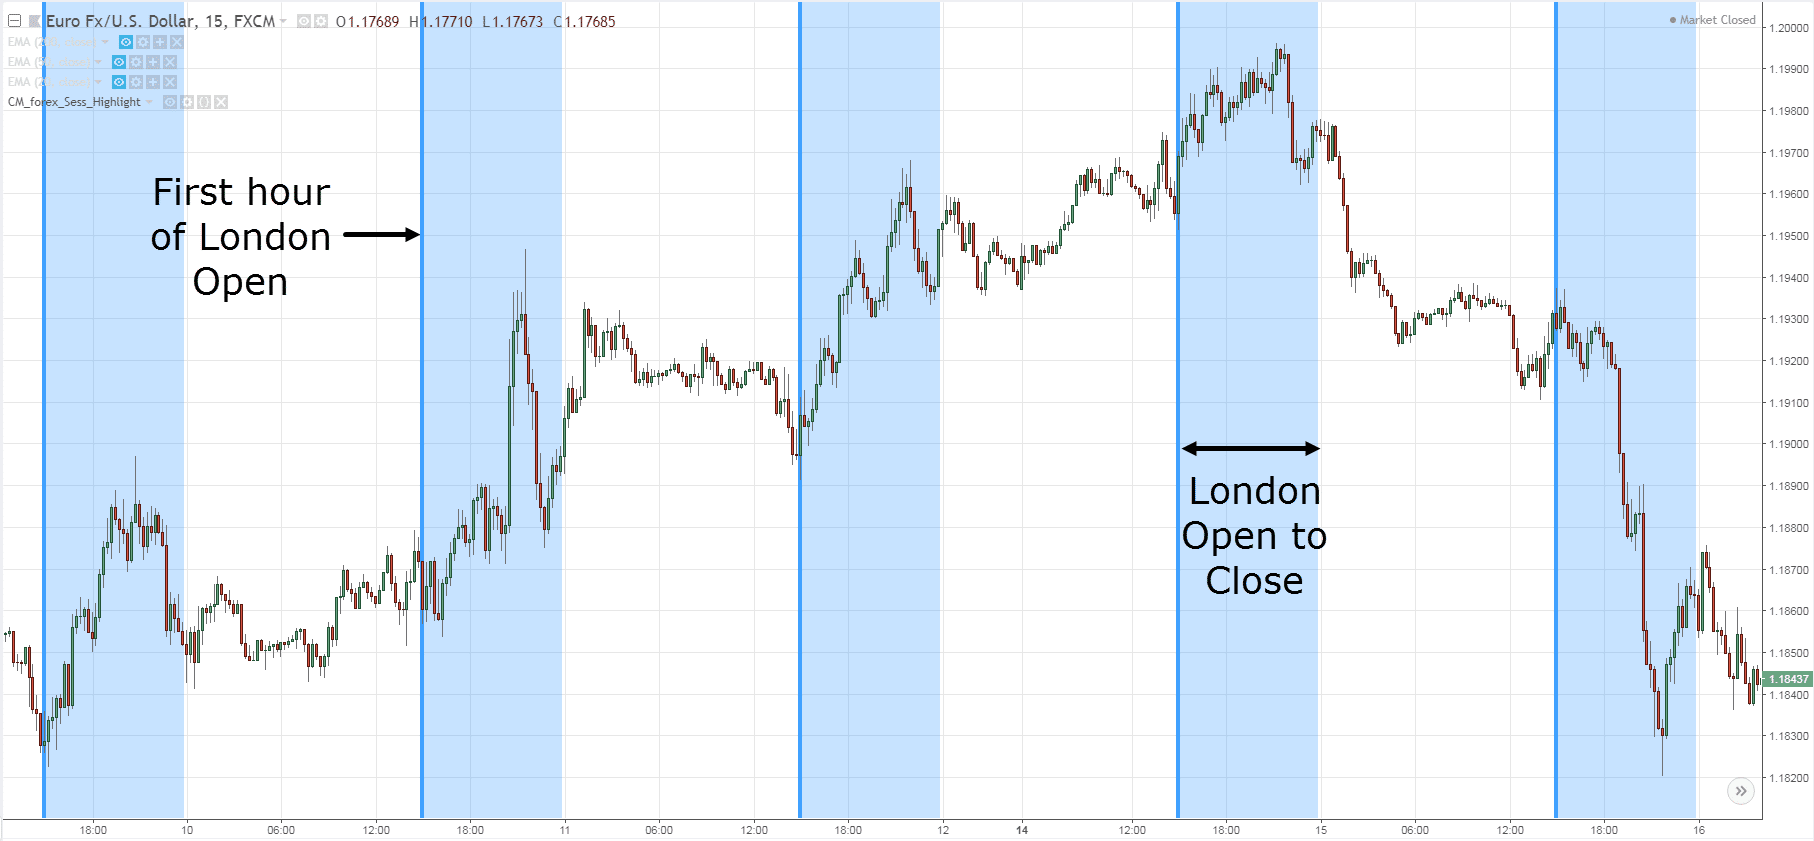
Chart Patterns: Ever seen a head-and-shoulders or triangle? These patterns often predict breakouts. I use them to confirm trades, especially during the London session.
Pros and Cons of Technical Analysis
Technical analysis helps me act fast. It’s perfect for short-term setups—scalping, day trading, even swing trades. But it’s not flawless.
Pros: It gives you clear entry and exit signals. You don’t need to read economic reports.
Cons: It can give false signals during news events or low liquidity. Also, if you rely solely on indicators, you might miss the bigger picture.
Fundamental Analysis: Looking at the Bigger Picture
Fundamentals focus on why prices move, not just how. Instead of charts, you’re analyzing economic data, central banks, and geopolitical events. It’s like looking under the hood of a currency pair.
Core Elements of Fundamental Analysis
These are the things I check every week:
Interest Rates: Currencies love high rates. When a central bank raises rates, that currency often strengthens. The Federal Reserve and ECB are ones I track religiously.
GDP and Inflation: A growing economy usually means a stronger currency. But if inflation spikes, central banks might hike rates, adding another layer.
Employment Data: The U.S. Non-Farm Payrolls (NFP) report can move markets like crazy. I avoid trading just before or after it unless I’m prepared for wild swings.
Geopolitical Events: Wars, elections, trade deals—these all affect sentiment. Even a tweet can shift the market if it comes from someone influential.
Pros and Cons of Fundamental Analysis
I used to avoid fundamentals because they felt too “macro.” But now I realize they explain long-term direction better than anything.
Pros: They help you understand the broader market narrative. You can position yourself before big moves.
Cons: It’s tough to time trades precisely with fundamentals. Also, interpreting data can get messy and subjective.
Technical vs Fundamental: Key Differences
| Aspect | Technical Analysis | Fundamental Analysis |
|---|---|---|
| Focus | Price charts and patterns | Economic and political events |
| Purpose | Timing trades, short-term trends | Understanding long-term currency value |
| Tools | RSI, MACD, support/resistance | Interest rates, GDP, central bank policy |
| Best For | Scalping, day and swing trading | Position trading, macro views |
When I’m day trading EUR/USD, I lean heavily on technicals. But when I see a major interest rate change on the horizon, I switch to a longer-term fundamental view. You don’t have to pick one side—learning both is what leveled up my trading.
Best Use Cases for Each Method
Here’s what I’ve learned: your trading style determines which analysis to prioritize. If you’re a scalper or day trader, you’ll probably live on the charts. But if you’re planning to hold trades for days or weeks, the news matters more than you think.
When Technical Analysis Shines
When I’m looking for quick entries and exits, I turn to technicals. Especially during high-volume sessions like London or New York open. One time, I used a simple RSI-MACD combo on the GBP/USD, spotted divergence, and bagged a tidy 40-pip move before lunch. No need to open an economic calendar.
These are perfect setups for traders who:
– Prefer shorter timeframes
– Need precise entry/exit points
– Want to avoid overthinking fundamentals
When Fundamental Analysis Takes the Lead
In early 2023, when the Fed hinted at rate hikes, I knew the USD would gain strength—even before the charts confirmed it. That’s where fundamentals give you the upper hand. They’re essential if you:
– Hold positions for days or weeks
– Trade based on macroeconomic themes
– React to central bank decisions
If you trade exotic pairs or less liquid sessions, understanding fundamental catalysts is even more important. The market doesn’t move without a reason—and fundamentals often are the reason.
How to Combine Both Approaches Effectively
This was a game-changer for me. Once I started using both types of analysis together, my results improved dramatically. It’s like having a map and a compass. You know where you’re going and how to get there.
Use Fundamentals to Set the Direction
I always start with the macro view. Is the Fed hawkish? Is the ECB dovish? Are inflation numbers soaring in the UK? This tells me whether to lean long or short on a currency pair. I don’t even open a chart before I’ve got this part clear.
Use Technicals to Time the Trade
Once I’ve got the bias, I jump on the charts. If fundamentals say USD is strong, I’ll wait for a pullback in EUR/USD and then enter short at a resistance level. Tools like moving averages and Fibonacci retracements help me pick the best spots.
Sample Trading Scenario with Both Methods
Let’s say the Bank of Canada is expected to raise rates. That’s your fundamental setup. You check USD/CAD and see a rising wedge—a bearish pattern. You wait for a breakdown, confirm it with MACD divergence, and enter short. That’s technical confirmation.
This combo reduces second-guessing. You’ve got logic and timing on your side.
FAQ: Trader Questions Answered
What is the best analysis method for forex beginners?
Start with technical analysis. It’s more visual and easier to grasp. But don’t ignore fundamentals. Even a basic understanding of interest rates and news events will save you from bad trades.
Can you trade forex without fundamental analysis?
Yes, especially if you’re day trading or scalping. But you’ll still want to check the economic calendar to avoid trading during high-impact news.
How do economic indicators affect currency prices?
They shape expectations. If inflation rises, traders expect rate hikes, which boosts that currency. Weak jobs data? That usually weakens a currency. It’s about predicting what central banks will do next.
What are the best indicators for technical analysis in forex?
I swear by RSI, MACD, and price action levels like support and resistance. Those three alone cover momentum, trend, and key zones. Perfect for building a trading setup.
How often should I check fundamentals when trading forex?
Check them at the start of the week and whenever there’s big news. For swing or position trading, I check daily. For day trading, I check before each session starts.
Recap of Key Points
We covered a lot, so here’s what matters most: technical analysis helps you time trades, while fundamental analysis helps you understand direction. Both are powerful. But when you combine them, that’s where the real edge lies.
Final Takeaway
Don’t limit yourself to one method. Let fundamentals set the scene and technicals guide your moves. It’s how I turned confusion into confidence—and how you can too.
Closing Thought
Forex isn’t just about picking sides. It’s about seeing the full picture. So next time you analyze a pair, ask yourself: What’s happening under the hood—and what are the charts saying right now? Trust me, answering both will put you ahead of 90% of traders out there.